
Last month, we started talking about testing early: identifying assumptions and risks, creating testable stories using flow diagrams. There are many other types of visualizing tools such as state diagrams, empathy maps or user role maps.
Janet believes one of the biggest areas that cause agile teams to slow down, is not recognizing dependencies early. Often a team doesn’t realize until they start to code or test, that they need another piece. We know you can’t identify everything up front, but there are some tools we can use to help us.
In this post, we’ll cover visualizing dependencies using context diagrams and dependency mapping.
Context diagrams
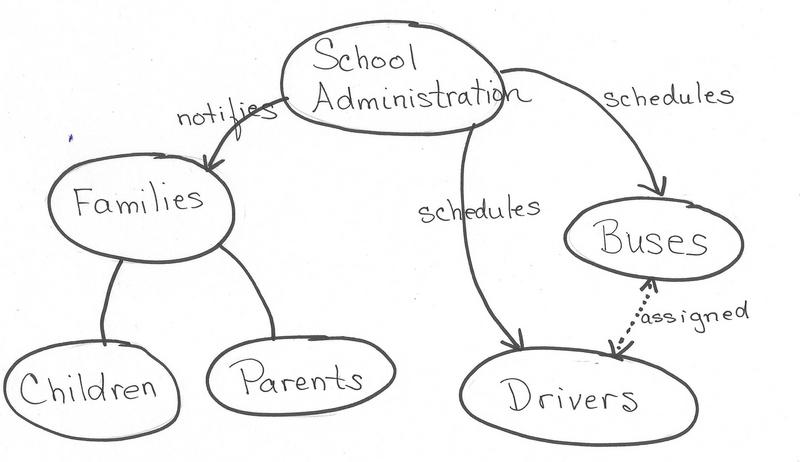
We’re pretty sure most of you use context diagrams whether you call them by that name or not. It is a diagram about how your application interfaces with others – humans, machines, APIs, or even other systems. You start by identifying the external entities with which the system interacts. Next, determine the flow of information between your system or application and those entities, looking to see which way the information flows – one direction, or is it bi-directional. For example, in this diagram for school administration, the focus was on bussing children to and from school. You can easily see the relationships and you can ask questions and determine what is missing.
Dependency Mapping
Lisa has done a few workshops where participants did simulations of different organizational structures. They used different mapping techniques to visualize those organizations and how they helped or hindered delivering the value customers wanted. Participants said they found dependency mapping the most useful.
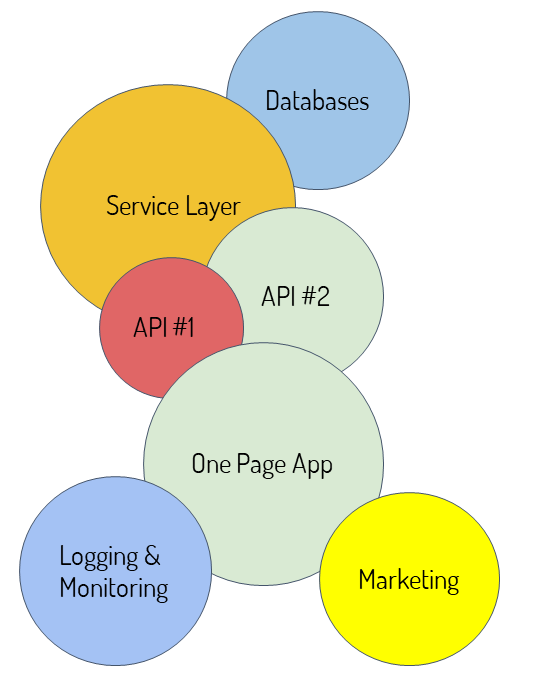
To start thinking about dependencies, choose the core piece of your product and draw it on a whiteboard or flip chart (virtual if needed). Then, represent all the pieces of the system that make that core piece work as circles, overlapping each other like a Venn diagram to show touch points. Circle size represents the impact of each piece. Color code them to show which team “owns” each one. Visualizing the dependencies often reveals bottlenecks that need to be addressed and helps identify the key people who can help. The diagram below shows a simplified map.
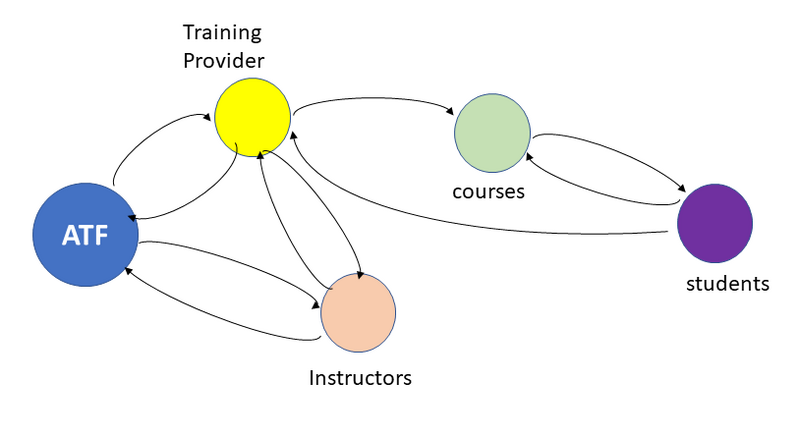
Dependencies can be represented within your application in different ways. This diagram shows some of the major components of our Agile Testing Fellowship (ATF) website and how they interact.
You can also look at individual features to see what impacts they may have on other parts of the system. If you can identify that a particular feature touches more than one team, that is a signal that you need to work with those other teams early to mitigate the risk.
Here is a link that might help get you started about talking about dependencies.