
Let’s look at a couple of visualizations that help teams identify and mitigate risk. In last month’s blog post, we described Rob Meaney’s visual for making problems visible and sparking discussions about them. Rob has another useful model that his teams use for identifying and mitigating risk. We’re obviously fans of models with quadrants and triangles, and this has both! The larger quadrants relate to the agile testing quadrants. The lower left quadrant is about mitigating risks around regression failures. These tests need to be fast and reliable, and they are less expensive to write and maintain.
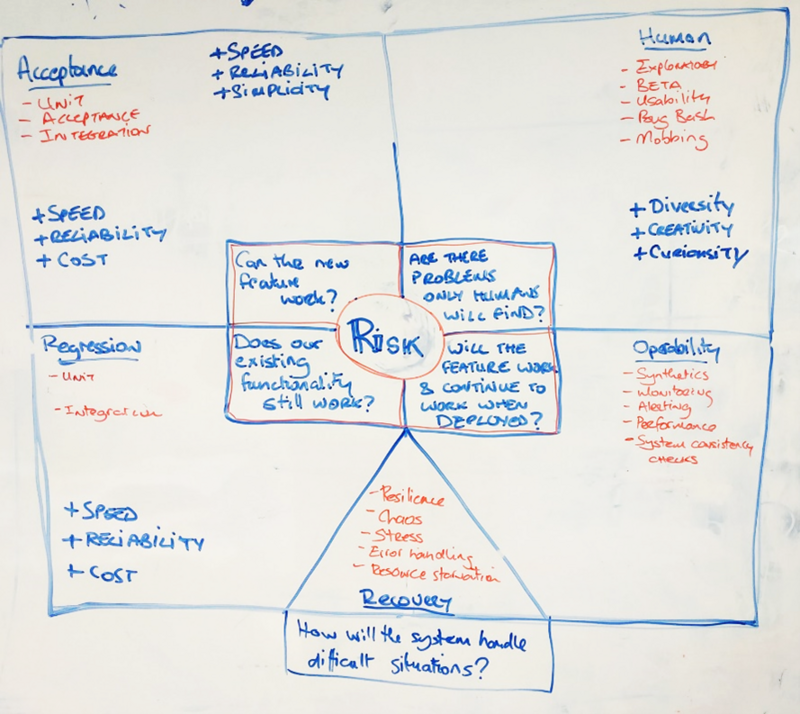
The top left quadrant has tests that confirm that features meet acceptance criteria. The focus should be on fast, reliable feedback at a minimum cost. For mitigating risks of problems that automated tests can’t find, the top right quadrant gets humans involved in the testing. The bottom right quadrant is concerned with making sure features work after they’re released. This is the contemporary approach to “testing in production”, monitoring and observing production use to catch problems as quickly as possible.
The small triangle at the bottom of the quadrants represents mean time to recovery. How fast can we detect problems in production and recover from them? We need to instrument our code for observability, so that we can quickly diagnose and fix failures.
We’ve found several of Dan Ashby’s models extremely effective as well. We encourage you to read some of his ideas. The one we share today is from his blog post: https://danashby.co.uk/2022/07/22/8-perspectives-of-quality-a-model/ .
Dan looks at quality from different perspectives, a similar approach to the one as we described last month, but from a different angle. He specifies four perspectives:
1. External quality – looking it from a product perspective by the users and customers
2. Internal quality – this is from product perspective by the organization and team
3. Team quality – is a process perspective about how well the team can deliver
4. Organizational quality – a more social perspective on how well the organization can support the team and the delivery of the product
Dan defines three stages of the product as columns in his model, the perspectives of: ideation, implementation, and support and maintenance
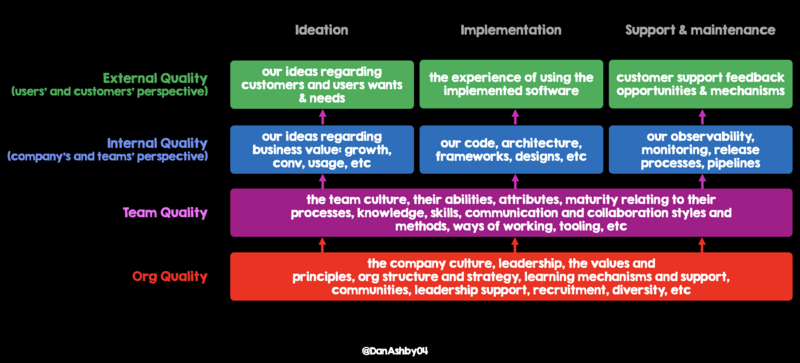
This model enables teams to talk about how different stakeholders of their products value with several aspects of quality. It illustrates the fact that quality must begin at an organizational level. A company that doesn’t understand the value of quality and why they should invest in it isn’t likely to deliver the level of quality that customers value. We encourage you to read Dan’s blog post for all the details. He also provides a visual that overlays different testing activities into the model.
Last month, we shared two excellent examples of visual models from Rob Meaney that help us talk about many aspects of testing and quality with our teams. Where are the biggest risks, where should we focus our testing? Asking core questions like “How will we test this?” lead to proactive risk mitigation and happier customers. Dan Ashby’s model gives us a way to look at quality from different perspectives and plan our testing activities accordingly.
Looking at quality from many perspectives and creating a form of visualization enables teams to have those necessary conversations to continue to improve.